
With rising sea levels and a higher occurrence of extreme weather conditions, the role of coastal protection is ever increasing. One European country, with long-standing experience in this area, is the Netherlands. Due to one-third of the country lying below sea level and the experiences during the horrible 1953 flood, many coastal protection systems have been constructed. These infrastructures can play a critical role in the energy transition as they allow rapid upscaling of marine energy solutions often at a reduced cost. For example, a currently active 1.25 MW demonstration in the Delta Works could be upscaled and expanded achieving up to 100 MW over roughly five years.
Tidal energy is independent of the weather and perfectly predictable over decades. It can therefore play a role to decrease our dependence on (Russian) fossil fuels when the wind is not blowing and the sun is not shining. The 100 MW tidal energy installation, considering the normal operating schedule of the Storm Surge Barrier gates, could deliver anything between 175 and 250 GWh/y. In a scenario, where this predictive source of electricity is fully used for the replacement of gas, this 100 MW installation would equal 17.9–25.6 million m3/y of natural gas[i] which again represents 0.34% of the gas used in the Netherlands for electricity in 2021[ii]. Over a runtime of 25 years of these turbines, the gas replacement would lead to a CO2 reduction of 1.8- 2.6 Mtons of CO2[iii]. Only considering the cost of gas as a fuel over a 25 year period and based on the peaking electricity price from natural gas in early March 2022 it would open up to 993–1420 Million Euros for the installation, operation, and decommissioning of a 100 MW tidal project[iv]. This amount would be roughly 110% of what is required to cover the full cost given the current Levelized Cost of Electricity (LCoE) of tidal energy (~200 € / MWh). If we assume tidal energy will achieve the forecasted cost reduction to an LCoE of 100 € / MWh by 2030 it would cover 230% of the costs required[v]. Of course, it is unlikely that the gas prices will remain this high, however, several European energy market analysts like AleaSoft are not expecting a return to pre-war gas prices before 2024/2025. And even if a drop in market prices appears there are subsidies that can help in the initial build-out of those climate-positive projects mitigating a price change even before its occurrence.
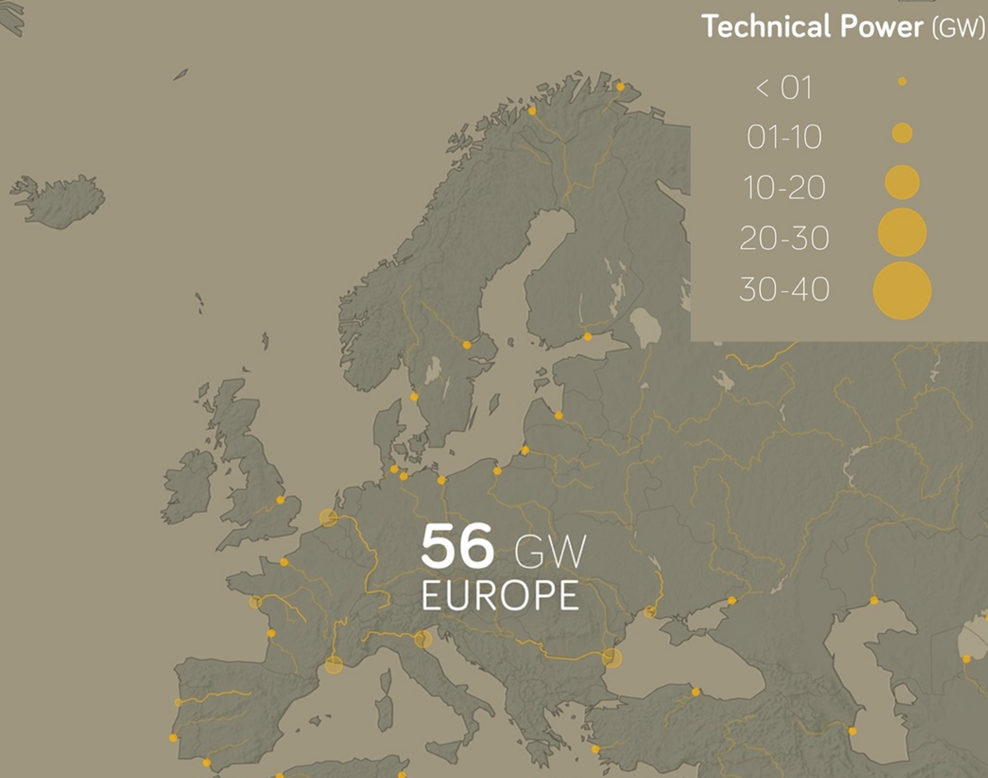
Further upscaling of tidal energy in dikes like the Afsluitdijk, IJmuiden, and others could double the amount of installed MW. Larger scale projects including artificial deltas or lagoons could increase it to several GWs only in the Netherlands before 2050. Other European countries are also excellently suited or even have already large-scale projects running. The 240 MW peak capacity Rance tidal power station in France is already operating for more than 50 years, double the lifetime assumed for the case described above, and produces 500 GWh per year at a cheaper price than nuclear power[vi]. Other storm surge barriers around Europe like the Eider Barrage in Germany or the MOSE project in Italy might be well suited for rolling this technology out.
Next to tidal energy, a yet little known, but high potential technology could provide tuneable baseload electricity to the European grid. Reverse electrodialysis utilizes varying salt gradients in water bodies for electricity production. It can be used at every location where freshwater streams into saltwater and can, while producing electricity, help re-establishing brackish water ecosystems in locations where storm protection had destroyed those. Therefore, those salinity gradient technologies are a great candidate for installation in already existing infrastructures. One prime example is the Afsluitdijk in the Netherlands. On this 32 km long dike the worldwide first demonstrator of the salinity gradient technology is operational. The demonstration there, currently in the kW size, could be upscaled to 50 MW over approximately five years.
These 50 MW considering demand fluctuations and maintenance time would produce about 350GWh/year. If 50% of those are used to replace gas, while the other 50% can replace the more constant output of coal, also 175 GWh of gas electricity could be replaced. Following the same logic as for the tidal case, this would open up 993 Mil EUR from the gas replacement and an additional 210 Mil EUR from the coal replacement [vii]. Again these calculations only include the fuel price excluding the costs of the associated infrastructure, but even so and at an LCoE of 250 EUR/MWh, 55% of the total costs to be expected from the salinity gradient installation could be covered.
Additional installations of 50–100 MW could be operated as an add-on to already existing infrastructure in The Hague, IJmuiden, and multiple locations in the province of Zeeland. A GW-sized system would be feasible for Rotterdam harbor. Throughout Europe, there is huge potential along all major rivers entering the sea basins and oceans. Some prominent rivers are the Po in Italy, the Rhone in France, and the Danube in Romania.
Europe is at the forefront of those innovations and their inclusion in suitable infrastructure. Individual countries like the Netherlands might have only a small portion of the global potential but can help all of Europe to become more energy independent, increase the amount of renewable energy, and further build out the innovative advantage. All of which will lay a foundation for a prosperous, sustainable, and independent Europe in the decades and centuries to come.
If you want to learn more about marine energy follow this publication and feel free to reach out to us at the Dutch Marine Energy Centre, an accelerator for marine energy solutions. Together with the innovative SMEs, project developers, utility companies, and our partners around the world we are working at the forefront of those innovations.
Acknowledgments:
Many parts of this work have been supported by the Interreg North-West Europe Ocean DEMO project. The technology developers referred to in the text are Tocardo BV and REDstack BV. Technologies like Fish Flow Innovations, Pentair, Andritz Hydro, Schottel Hydro, and others could also be applicable for installation in dikes. All calculations performed can be found below.
Calculations:
Disclaimer: We are aware that the calculations below are over-simplified as the exact reduction of gas is dependent on the demand-supply matching where gas still plays a significant role. Detailed energy system models can help to quantify how much tidal energy exactly can reduce the gas consumption which could lower the above calculation significantly. However, a tidal system is an excellent partner for a battery system as the charging of the battery is fully predictable and would lead to a completely flexible system. In this case, the additional cost of battery systems would need to also be taken into account.
Tidal GWh produced per year: Capacity x Capacity factor x hours/year ÷ conversion of MW to GW = 100 MW x 0.2/0.3 x 8760 h ÷ 1000 = 175–250 GWh/y
For calculating the amount of gas/year this GWh/year value gives, the Gasunie calculator was used = 17.9–25.6 mln m3/y this value was compared with the yearly gas consumption for electricity in the Netherlands.
Percentage of gas replacement per year: ‘Gasunie value’ ÷ ‘Gas used via the main grid Electricity power plants’ x 100% = 25.6 mln m3/y ÷ 7,573 mln m3/y x 100% = 0.34 %
Carbon dioxide emission replacement: Considering a similar amount of carbon dioxide emission from the construction of a gas power plant compared to the inclusion of tidal power into infrastructure: ‘CO2 emissions per kWh’ x ‘Tidal kWh produced per year‘ x ‘Lifetime’ 0.413 kg/kWh x 250,000,000 kWh/y x 25 y ÷ 1000kg/t = 2.581 Mtons CO2
Cost of electricity from gas over 25 years runtime: ‘Tidal GWh produced per year’ x ‘life-time’ x ‘gas price march 21’ = 175/250 GWh/y x 25 y x 227 EUR/MWh x 1000MWh/GWh = 993–1420 Million EUR
Tidal project cost in %: ‘gas price march 21’ ÷ ‘Tidal LCOE’ = 227 EUR/MWh ÷ 100/200 EUR/MWh x 100% = 227/113%
Salinity GWh produced per year: Capacity x Capacity factor x hours/year ÷ conversion of MW to GW = 50 MW x 0.8 x 8760 h ÷ 1000 = 350 GWh/y
Cost of electricity from coal over 25 years runtime: ‘Salinity GWh produced per year’ ÷ 2 x ‘life-time’ x ‘coal price per ton march 21’ x ‘MWh per ton’ = 175 GWh/y x 25 y x 390 EUR/t ÷ 8.14 MWh/t x 1000MWh/GWh = 210 Million EUR
Salinity project cost in %: (‘Cost of electricity from coal’ + ‘Cost of electricity from gas’) ÷ (‘LCOE salinity’ x ‘GWh produced per year’ x ‘life-time’) = (993 Mil. EUR + 210 Mil EUR) ÷ (350 EUR/MWh x 25 y x 350,000 MWh/y)